GAP criterion is wrong in tomography
by Ivan Koulakov (IPGG, SB RAS, Novosibirsk, Russia)
e-mail: ivan.science@gmail.com
GAP criterion of data selection for local earthquake tomography (LET) means rejecting all the sources outside the station network perimeter. Here we claim that this criterion is wrong and it can be a reason for significant reduction of relevant data that leads to lower quality of inversion. Indeed, the location quality depends on the angular coverage, however it should be considered in 3D, and not in the horizontal projection, as presumed by the GAP criterion. It is clear that a shallow event occurred slightly outside the network might be better located, than a deep event located within the network perimeter. We claim that the outside events are of great importance for improving the result quality. This statement is supported by synthetic testing. We present an example when using shallow events located merely outside the network provides better reconstruction quality than in the case of using deep events with horizontal projections inside the network.
Description of the testing results (Manuscript submitted to BSSA in July 2008):
Text, figures and supplementary, gap.pdf (1200 kB)
Brief description of the work:
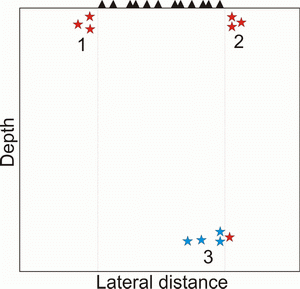
In the practical realization of tomographic inversion according to LET scheme, using the GAP criterion causes a paradox situation which is illustrated in Figure 1. A shallow source located just few kilometers outside the network is rejected (red stars in clusters 1 and 2), while a deep earthquake at a depth of several hundreds kilometers (blue stars in cluster 3) is taken into consideration (Figure 1). At the same time, it is possible that the accuracy of the first event location is higher than of the second one.

Figure 1. Sketch showing nonsense of the GAP criterion. Stars indicate events in three clusters in a vertical profile; triangles on surface indicate station projections. It is obvious that events in clusters 1 and 2 are much better located than blue stars in a deep cluster #3. At the same time, GAP criterion selects only events indicated by blue.
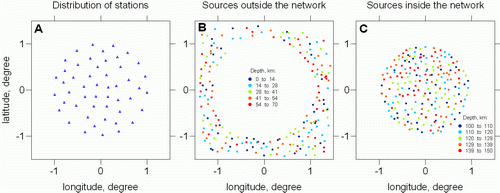
We model two different situations. In both cases we consider a seismic network consisting of 50 more or less regularly distributed stations (Plot A in Figure 2). The area of the station distribution is roughly isometric and is of ~200 km size. In both cases we generated the data with 200 events. For each event the number of recorded P picks varies randomly from 25 to 50. For 40%-80% of the recorded P picks we create the S picks. In total, for each dataset, we have produced 12191 pairs of source/receivers corresponding to 7648 P and 4543 S phases. These numbers reflect roughly the situation in real datasets. We have installed the sources manually and assigned randomly the depth for each event in a limited depth interval. In the first model (Plot B in Figure 2) we have placed the sources merely outside the perimeter of the network. The depths for these events varied from 0 to 70 km. In the other data set (Plot C in Figure 2) we used deeper events (in the depth range from 100 to 150 km) located within the station area. If we took into consideration the GAP criterion, we would obtain tomographic results for only the second case, while in the first case, realization of inversion would be impossible.

Figure 2. Configurations of sources/receivers used in the two tests. A. Location of stations (same in both cases). B and C: Locations of outside and inside sources respectively. Colors of dots correspond to source depths according to the scales.
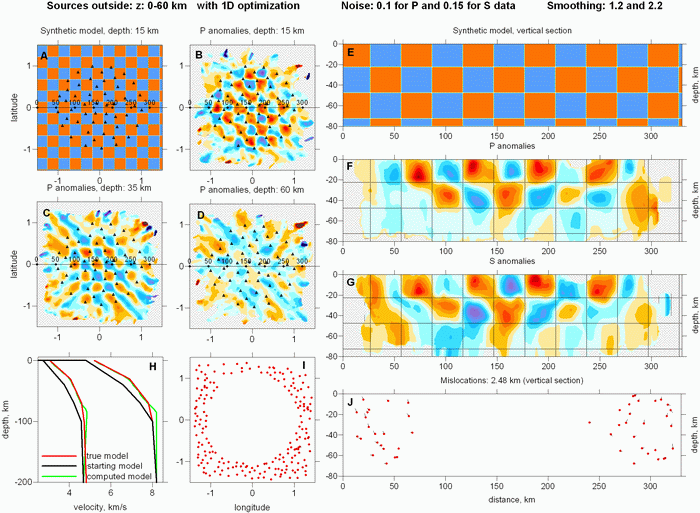
The results of 3D checkerboard reconstruction for the case with outside sources are presented in Figure 3. First of all, it should be noted that the optimized 1D velocity model (green line in Plot H) fits with the true model (red line) only in the depth interval roughly corresponding to the depth distribution of sources (0-70 km depth). Resulting horizontal sections (Plots B, C and D) show that the checkerboard structure is robustly reconstructed in the two uppermost layers of the checkerboard (from -2 to 23 km and from 23 to 48 km). For the third layer (48-73 km) the resolution becomes poor. This is also confirmed by vertical sections F and G presenting P and S velocity anomalies. The interface between two checkerboard layers at 23 km depth is clearly resolved at a correct position. The relocated sources after fifth inversion iteration are presented in Plots I and J in the map view and in a vertical section. In this case, the RMS of locating error with respect to true coordinates is 2.48 km.

Figure 3. Inversion results using the sources located outside the network. A and E: synthetic model in a horizontal section (15 km depth) and a vertical section (position of the section is indicated in A). Triangles show locations of stations. B,C and D: resulting P velocity anomalies in horizontal sections. F and G: resulting velocity anomalies of P and S velocities in the vertical section. H: result of the 1D model optimization. Red line is the true model; black line is the starting model; green line is the retrieved model. I and J: locations of events in map view and in the vertical section. Red dots are relocated sources; bars show errors with respect to true coordinates.
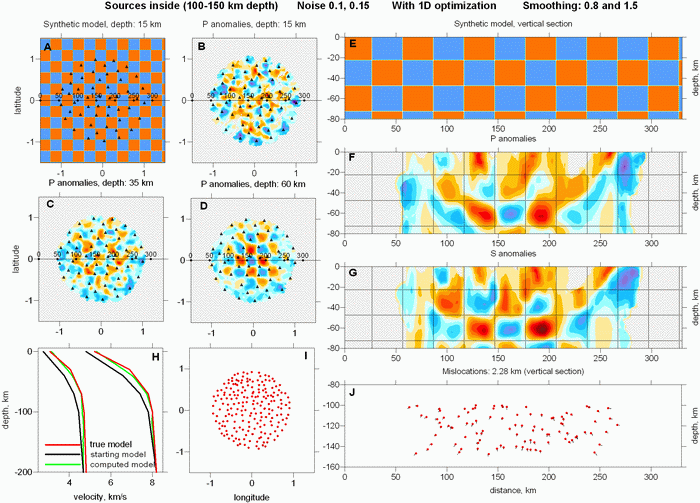
Significantly different situation is observed when we use the sources located inside the network in the depth interval of 100-150 km (Figure 4). The optimized 1D model fits to the true model at 0 - 150 km depth that corresponds to the interval of ray propagations. The horizontal sections B, C and D show that the satisfactory resolution is observed only for the third layer (48-73 km). Some structures can be seen for the second section (23-48 km), but much poorer than in the first case shown in Figure 3. Structures in the uppermost layer are not resolved at all. In vertical sections, we can see that the interface between 2 and 3 layers at 48 km depth is well resolved, while the interface at 23 km depth is not visible. The RMS of location errors in this case is 2.28 km, that is of the same order of magnitude as in the first case.

Figure 4. Inversion results using the deep sources located inside the network. Meaning of plots and indications are the same as in Figure 3.
These results show that rejecting the sources outside the network is a wrong way which can affect dramatically the reconstruction results. It means that more liberal criteria for data selection should be used. For example, in LOTOS-07 code we consider the events if the distance to the nearest station is less than a predefined value (e.g., 100-150 km). For each individual case, this value should be evaluated based on configuration of the network and results of synthetic modeling.
We address to all members of the tomographic community to repudiate the GAP criterion, as it is presently used. In this paper we have shown that rejecting the data using this criterion might have strong negative effect on the results of tomographic inversion. We hope that the presented results will break the stereotype about the using the GAP in tomographic studies. This conclusion could be of great importance for improving the quality of new data sets processing and revision of old datasets based on more liberal data selection criteria.
In addition, we have produced a number of other synthetic tests with different configurations of anomalies, with and without noise, with other number of rays, with and without optimization of the 1D model etc. Some of the results are presented in the supplementary section .
To express of any criticism and comments do not hesitate to contact the author, Ivan Koulakov, e-mail: ivan.science@gmail.com


